Project Overview.
A shoe retailing company contacted me, a marketing undergraduate student, to take a look at their yearly sales data. The company wanted to find out which brand is doing the best and bringing the most profit. They had set up some sales targets, but they didn’t know why some of them were not met. I was tasked to reorganise the raw sales data into meaningful information and provide visualisation and insight into specific brand performance. More specifically, I was tasked to set up different KPIs based on regional, seasonal, brand and, customer demographic sales data.
Technical Skills Involved
- Data Visualizations with Tableau and SPSS
- Quantitative Market Analysis
- KPI Determination
Content Demostration
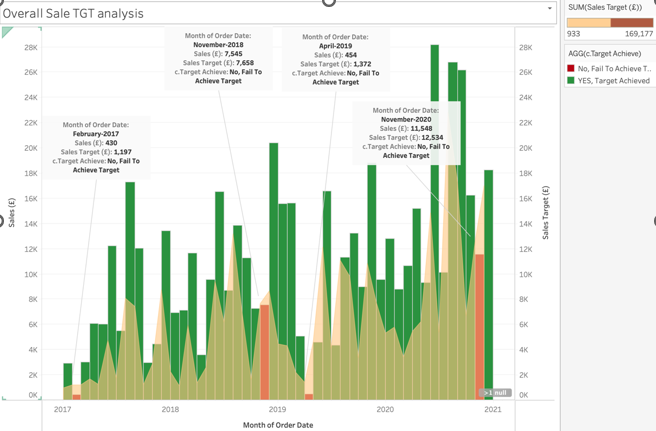
- Analysis on how sales goals were met each year and observe and seasonal trend
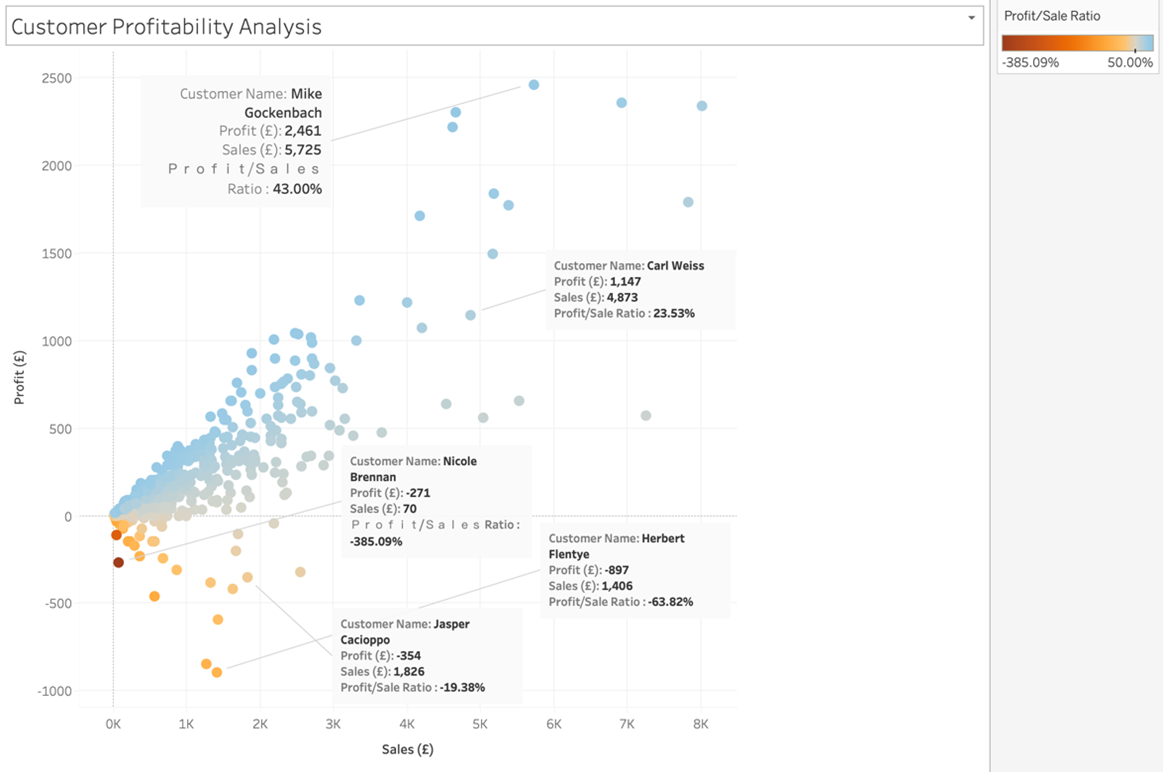
- Illustrate how profitable each customer was, those who generated the most sales do not guarantee they also generate a proportional amount of profit. Each customer’s sales records were plotted on the Profit vs Sales chart, the colour of the dots indicates the profitability ratios.
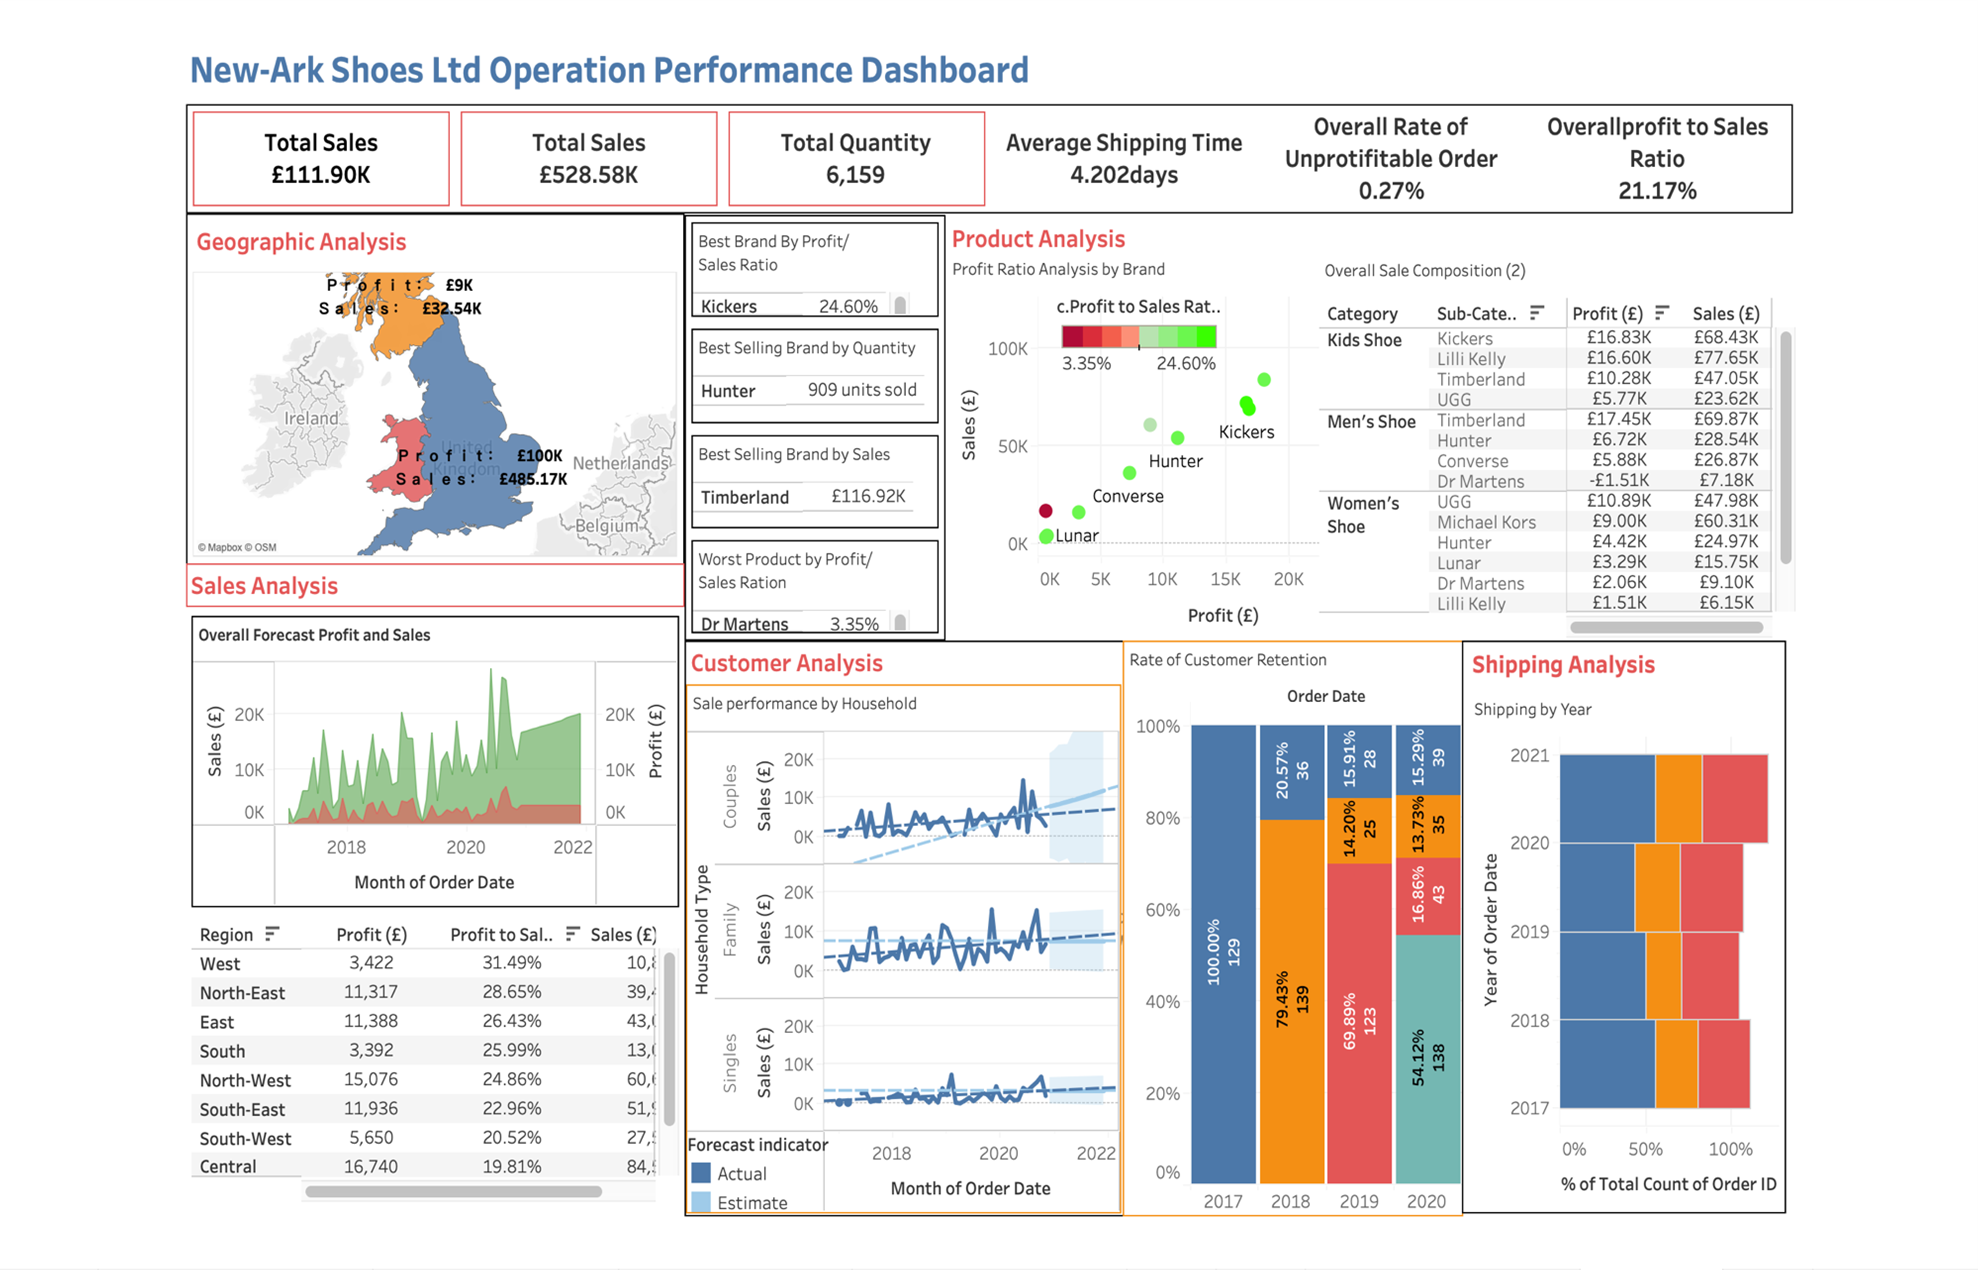
- Little pieces of information were put together into a ‘dashboard’.
Full Report
View Full Report